Lite Studio Webclip

Simplify Your Website. Elevate Your Brand.

Schedule a call with our expert web design and answer engine optimization team today to discuss how we can improve search visibility and upscale your brand's online presence in just 30 days.

Schedule Call

User Behavior Data for Search Optimization

Matt Clark Lite Studio Headshot
Matt Clark
March 6, 2026
User engagement metrics now determine search rankings. Master CTR optimization, reduce bounce rates, leverage mobile-first design & AI-driven insights to transform your search performance. Get actionable strategies that convert.

Article Summary

What user behavior metrics impact search rankings the most?

Click-through rate, bounce rate, session duration, and scroll depth are the primary metrics search engines use to evaluate content quality and user satisfaction, directly influencing your rankings.

How does mobile optimization affect user behavior and SEO?

Mobile searches dominate with over 59% of traffic, and sites that load in under 3 seconds retain 53% more visitors, making mobile-first design essential for engagement and search visibility.

Why is AI changing search optimization strategies?

By 2026, traditional search volumes may drop 25% as AI-driven tools take over. AI analyzes user behavior patterns to deliver more personalized results, requiring content optimization for both humans and AI systems.

What tools help track and improve user behavior metrics?

Google Analytics 4, Search Console, heatmap tools like Hotjar, and A/B testing platforms provide actionable insights to identify friction points and optimize user experience for better search performance.

How does user behavior data translate to business results?

High-engagement pages convert visitors at 4.4x higher rates than low-engagement content. Optimizing based on user behavior data directly improves both search rankings and revenue generation.

Search engines now prioritize user engagement metrics like click-through rate, bounce rate, and session duration to rank content. This means your website's success depends on how well it satisfies user intent and keeps visitors engaged. Here's what you need to know:

  • Key Metrics Matter: Metrics like scroll depth, dwell time, and navigation patterns signal to search engines how valuable your content is.
  • User Behavior Influences Rankings: Actions like "pogo-sticking" (users leaving your site quickly) can harm rankings, while higher engagement boosts visibility.
  • Mobile Optimization Is Crucial: With mobile searches dominating, ensuring fast load times and user-friendly layouts is key.
  • AI Is Changing Search: By 2026, traditional search volumes may drop by 25% as users rely more on AI-driven search tools and virtual assistants.
  • Actionable Insights Drive Results: Tools like heatmaps, A/B testing, and Google Analytics can help identify friction points and improve user experience.

Bottom Line: Search optimization now requires understanding and acting on user behavior data. By focusing on metrics that matter and leveraging AI-driven tools, you can improve rankings, engagement, and conversions.

A discussion of UX for SEO | Search Off the Record

Core User Behavior Metrics for Search Optimization

Key User Behavior Metrics That Impact Search Rankings

Understanding how users interact with your content is essential for improving search performance. Let’s dive into the key engagement metrics that influence how search engines perceive your content.

Click-Through Rate (CTR) and Bounce Rate

The click-through rate (CTR) measures how often users click on your link after seeing it in search results. Each click signals relevance to search engines [7][1]. For instance, in 2022, the top-ranked result had a 20.5% CTR, compared to 13.32% for the second position. By the time you hit position #10, the CTR drops to just 7.95%. The first five results collectively capture a staggering 67.60% of all clicks, leaving positions 6-10 with only 3.73% [9].

"The ranking itself is affected by the click data. If we discover that, for a particular query, hypothetically, 80 percent of people click on Result No. 2 and only 10 percent click on Result No. 1, after a while we figure probably Result 2 is the one people want. So we'll switch it." - Udi Manber, Former Search Quality Chief, Google [9]

On the other hand, bounce rate measures the percentage of visitors who leave after viewing only one page. While a high bounce rate often signals a mismatch between user expectations and content, context matters. For example, someone finding a phone number on a contact page and leaving quickly is not the same as someone abandoning a product page. Common causes of high bounce rates include irrelevant content, confusing design, or technical issues like slow load times [7][5].

A great example is XBMC-Skins.com, which ranked #2 for "kodi skins" but achieved a 39% CTR - far above the 27% average for that position. The site’s owner, Mark Whitney, improved user engagement by adding filters for easier feature comparison. This boosted engagement helped the site maintain its ranking and project 3,758 clicks [6].

Session Duration and Scroll Depth

Metrics like session duration and scroll depth go beyond clicks to reveal how deeply users engage with your content. Session duration measures the total time spent on your site, while dwell time focuses on individual page engagement [7][9]. For most websites, an average session duration of 2 to 4 minutes is considered solid [5]. However, users are impatient - if your page takes longer than 4 seconds to load, many will bounce back to search results [9].

Scroll depth shows how far users scroll down a page, helping pinpoint which content grabs attention and which gets overlooked. If visitors rarely scroll past the first screen, your key information might be buried too far down. Search engines monitor these patterns to understand whether users find your content engaging enough to consume fully.

Heatmaps and Navigation Patterns

To complement time and scroll metrics, tools like heatmaps provide visual insights into user behavior. Heatmaps visually represent where users click, move their mouse, or focus their attention. Tools like Hotjar (now Contentsquare), Microsoft Clarity, and Crazy Egg highlight "hot spots" on your pages, revealing areas of high interaction [11][4][12]. These insights can uncover issues like unclickable buttons users try to click or overlooked calls-to-action.

Navigation patterns track how users move through your site, helping you identify bottlenecks or broken flows that hinder progress to high-value pages [8][5]. For instance, a high exit rate on checkout pages or lead forms often signals technical problems or content gaps that need fixing [5].

Google’s "Reasonable Surfer" model adds another layer of complexity. According to this model, links in prominent positions - like those at the top of a page or in bold text - are more likely to be clicked and carry more weight than links buried in sidebars or footers [6]. Through Chrome browser data, Google can analyze detailed user interactions, such as mouse movements and key presses, to determine whether someone is actively engaging or has simply left the tab open [6].

How to Use User Behavior Data for Search Optimization

Using the metrics mentioned earlier, you can make informed changes to improve user experiences. Modern optimization combines SEO, UX, and CRO into what’s now called Search Experience Optimization (SXO). This method focuses on the entire user journey, not just the initial click [3]. Below are strategies to turn user behavior data into actionable improvements.

Improving Page Layout and Content Placement

Search engines give more weight to links that are prominently placed - such as those at the top of a page, in bold, or in larger fonts - compared to links buried in footers or sidebars [6]. This means your page layout plays a key role in how search engines assess your content's value.

To refine your layout, analyze scroll depth data to identify where users tend to leave. For instance, if mobile users consistently drop off at 60%, consider moving key calls-to-action (CTAs) to the 40% or 50% mark to catch their attention earlier [13]. Tools that track scroll depth can help you zero in on these critical points.

Heatmaps are another powerful tool. They show where users focus their attention and which elements they ignore. For example, if a CTA is in a low-engagement area, repositioning it could improve both user experience and search rankings. Heatmaps can also highlight design issues - like users repeatedly clicking on non-clickable elements. Chrome's MetricsService offers detailed insights into behaviors like mouse movements and scrolling patterns, which can help you refine your layout [6].

"SEO as we know it might be dead, but the future of search is analyzing and predicting user behavior in order to optimize accordingly." - Giulia Panozzo, Neuroscientist and Marketer [3]

Optimizing for Mobile Users

Mobile users interact with websites differently than desktop users, so it’s crucial to analyze behavior by device type [4][13]. As AI chatbots and virtual agents grow in popularity, traditional search volume is expected to drop by 25% by 2026 [3].

"Mobile users interact with content fundamentally differently than desktop users. A content structure that works well on desktop may create frustrating experiences on mobile devices." - Terrence Ngu, AI SEO Specialist, Hashmeta [4]

To address mobile-specific challenges, focus on adjustments like increasing font sizes and breaking up long paragraphs into smaller, scannable chunks [13]. Track mobile interactions, such as clicks on FAQ accordions, to see what topics resonate most with mobile users [13]. High bounce rates or "pogo-sticking" (where users quickly return to search results) often point to a mismatch between your content and mobile search intent [4][1].

Google Analytics 4 can help you monitor metrics like Engagement Rate and Average Engagement Time for mobile users. These insights can highlight pages that need layout tweaks [13]. For mobile success, prioritize fast load times, ensure content displays consistently across devices, and make sure essential information stands out from ads or clutter [10]. Additionally, mobile users are increasingly using longer, conversational queries, often driven by AI-powered search tools like AI Overviews [3][10].

A/B Testing and Continuous Improvement

Once you’ve made changes to your layout or mobile design, A/B testing is key to refining those updates. This method allows you to measure the impact of specific adjustments using real behavioral data. Before starting, record baseline metrics like Click-Through Rate (CTR), dwell time, bounce rate, and scroll depth [4][14]. This helps you track the effectiveness of your changes.

Focus on high-traffic pages with low engagement for the fastest results [4][13]. Use behavioral insights to create clear hypotheses. For example, if users drop off at the 50% scroll mark because the content becomes overly technical, simplify the language or add visuals [4][13]. Test one or two elements at a time - such as headlines, CTA placement, or content structure - to identify what drives improvements [4][14].

After implementing changes, compare updated metrics to your baseline. Apply successful strategies to similar pages across your site [4][13]. Pay close attention to internal site search terms that lead to high exit rates - they highlight content gaps that need addressing [13]. Keep a record of every change to identify patterns and avoid repeating errors [3].

Remember, even a one-second delay in page load time can reduce conversions by 7%, and 88% of users are unlikely to return after a single poor experience [14].

For businesses looking to elevate their search optimization through user behavior insights, Lite Studio offers expertise in data-driven UX research and design to help you implement these strategies effectively.

How AI Analyzes User Behavior Data

AI has redefined how we interpret user behavior, going beyond basic metrics to reveal patterns that traditional analysis often misses. Machine learning algorithms can now analyze datasets such as mouse movements, scroll depth, and click patterns, uncovering trends on a large scale [4][17]. These systems not only track user actions but also predict future behaviors based on historical data.

A standout capability of AI is Natural Language Processing (NLP), which categorizes search queries and on-site interactions into intent types: informational, navigational, transactional, or commercial investigation [16]. For example, AI can differentiate between someone researching "best running shoes" (commercial investigation) and someone searching "buy Nike Air Zoom Pegasus 40" (transactional intent). This allows businesses to tailor content or calls-to-action to match where users are in their journey.

Modern search engines have taken this a step further by using active learning to adjust rankings in real-time based on user preferences [6]. Google's systems can even detect whether a user is actively engaged with a page or if the tab is idle [6]. This means engagement depth, rather than just clicks, plays a crucial role in rankings.

AI also generates synthetic datasets to simulate user behavior when real-time data is limited [17]. This predictive power helps identify which content changes will drive better engagement. For instance, if users drop off due to overly technical language, AI might suggest simplifying the content [4][16]. These advancements pave the way for more personalized and predictive strategies.

Predictive Analytics and Personalization

Predictive analytics uses past behavior to anticipate future actions, enabling personalization engines to adapt content, search results, and calls-to-action dynamically based on user intent [15][16]. This goes beyond product recommendations - it transforms the entire user experience.

For instance, if a user has browsed multiple comparison articles and pricing pages, AI might display a "Compare Plans" button rather than a generic "Learn More" prompt [16]. In 2024, the footwear brand Vans used Google's AI-driven Performance Max to deliver personalized messages to specific audiences, such as skateboarders or parents. This approach resulted in a 46% boost in conversions and an 86% increase in sales compared to earlier methods [19].

Similarly, Les Mills, a fitness brand, leveraged Demand Gen AI campaigns over four weeks to attract new subscribers through visual storytelling. The results? A 561% rise in sign-ups and a 72% lower cost per trial [19].

To implement intent-based personalization effectively, segment visitors using AI tools that analyze behavioral signals like scroll depth and interaction rates. This ensures content aligns with user intent, enhancing targeting efforts [4]. Given that 93% of online experiences start with a search engine, AI's ability to interpret intent is crucial for generating leads [1].

AI-Driven Voice and Generative Search Optimization

Voice search and generative AI are reshaping how users interact with search engines. By 2026, traditional search volume is expected to drop by 25% as users increasingly turn to AI chatbots and virtual assistants [3]. This shift calls for new optimization strategies like Answer Engine Optimization (AEO) and Generative Engine Optimization (GEO).

"The future of search is analysing and predicting user behaviour in order to optimise accordingly." – Giulia Panozzo, Neuroscientist and Marketer [3]

AEO focuses on delivering concise, fact-based answers for platforms like voice assistants and featured snippets [18][16]. GEO, on the other hand, ensures content is structured for AI models to extract and summarize effectively, as seen in tools like Google AI Overviews and ChatGPT [18]. By March 2025, Google AI Overviews appeared in 13.14% of all search queries, nearly doubling from 6.49% in January 2025 [18].

AI decodes user intent by analyzing behavioral signals such as navigation paths and click patterns [18][16]. For example, if users consistently explore multiple articles after an initial query, AI recognizes the need for comprehensive answers. This is why topic clusters, or content hubs that cover subjects in detail, now outperform narrowly focused pages.

In 2025, Folloze shifted its strategy from keyword-focused pages to in-depth topic clusters. This approach led to a 68% increase in long-tail keyword rankings year-over-year across its content library [18]. The takeaway? AI favors content that anticipates follow-up questions rather than just addressing the initial query.

For voice and generative search, structure your content with standalone answer blocks - short, self-contained explanations that AI can easily extract and quote [18]. Use simple, clear language to reduce confusion for AI models. For instance, replace jargon like "Our proprietary methodology leverages synergistic frameworks" with straightforward phrasing like "Our method combines three proven strategies to improve results."

Additionally, consider multimodal search optimization, which pairs text with high-quality visuals, as AI now supports searches using images or uploads [10]. Use Schema markup (e.g., mentions, about, sameAs) to help AI establish factual connections [18].

For businesses navigating this evolving landscape, Lite Studio offers expertise in AEO and GEO strategies. Their data-driven research and optimization techniques are designed to enhance visibility in an AI-first search environment.

Turning Data Insights into Results

Collecting user behavior data is just the first step. The real challenge - and opportunity - lies in using those insights to take targeted actions that address user friction. This process can lead to better conversions, improved engagement, and higher search rankings. Think of it as diagnosing and solving the root causes of user frustration.

One effective way to approach this is by treating optimization as a diagnostic process. For instance, when traffic declines or conversions slow down, these are just symptoms. The real issue often lies deeper. Tools like Google Search Console, heatmaps, and session recordings can help uncover the underlying problems. Once identified, you can take focused action - like tweaking layouts or refreshing content. Here’s an example: if internal search data shows users frequently looking for "return policy" but not finding it, that’s a clear sign you need to make trust indicators more visible, such as adding “free trial” or “no credit card required” messaging to reduce hesitation [3][13].

To prioritize fixes effectively, use an impact-versus-effort matrix. Start by addressing high-impact issues on pages with the most traffic. Once those are resolved, move on to lower-priority improvements [3][20].

Also, segmenting your data - by device, traffic source, or user intent - can uncover patterns that aggregated metrics might hide. This granular view provides a clearer picture of user behavior and helps you fine-tune your strategy [4][2].

Case Study: Using Behavior Data to Increase Conversions

Mark Whitney’s approach to identifying and solving user friction is a great example of how data can drive real results [6]. Back in 2015, Whitney, the owner of xbmc-skins.com, noticed through navigation analysis that users wanted tools like faceted filters and side-by-side comparisons to evaluate Kodi skins more easily. The official Kodi site didn’t offer this functionality, so Whitney stepped in.

By implementing these features based on user behavior data, Whitney addressed the friction points directly. His precise, data-backed updates allowed xbmc-skins.com to outrank the official Kodi page for key terms. This success highlights how a diagnostic approach can outperform random trial-and-error optimization [6].

Best Practices for Long-Term Optimization

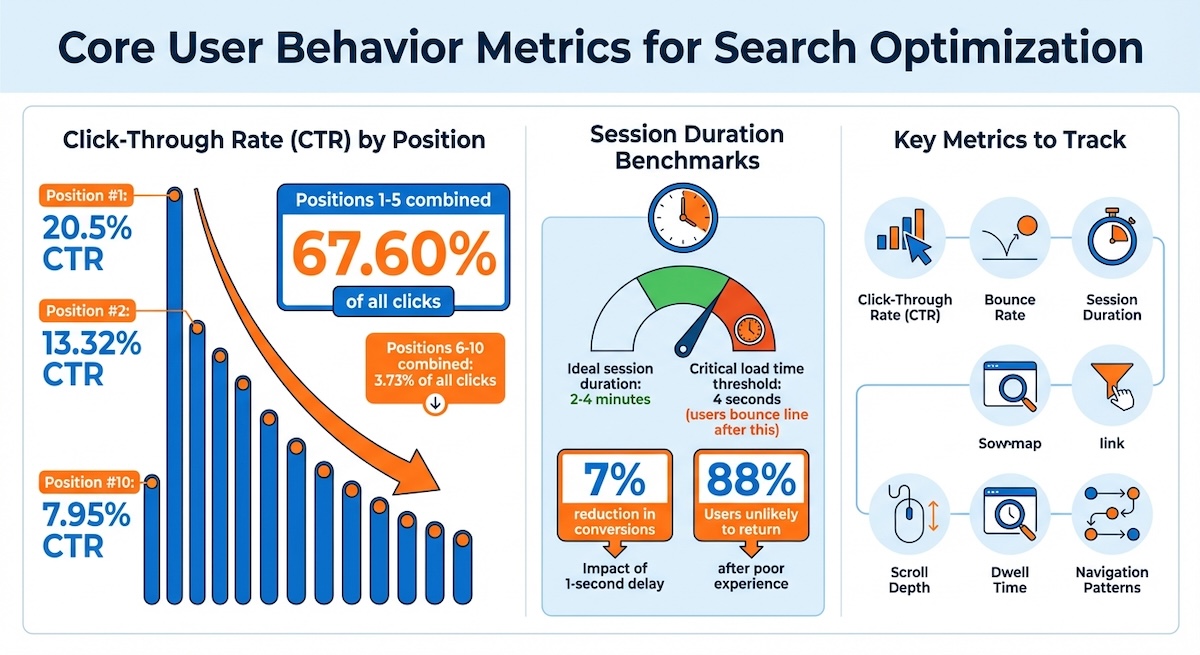
Effective optimization isn’t a one-time effort - it’s a continuous cycle of measuring, refining, and improving. Start by setting baseline metrics for key behaviors like click-through rates, scroll depth, and engagement. Without these benchmarks, it’s impossible to measure the real impact of your changes [4][20].

Keep detailed records of every change you make and the specific user need it aims to address. This documentation not only creates a valuable knowledge base but also helps identify opportunities that can be applied across different pages or domains. For instance, insights from one landing page might inspire updates on similar pages [3][4].

Combine hard data with qualitative feedback for a complete picture. While analytics tools can tell you what users are doing, surveys, customer support logs, and session recordings can help explain why they’re doing it. This blend of quantitative and qualitative insights is key to effective optimization [4][3][21].

For companies adapting to the rise of AI in search, Lite Studio offers specialized services to turn user behavior insights into actionable strategies. Their expertise in UX research and AEO (Answer Engine Optimization) helps businesses tackle friction points and improve visibility in both traditional and AI-driven search environments.

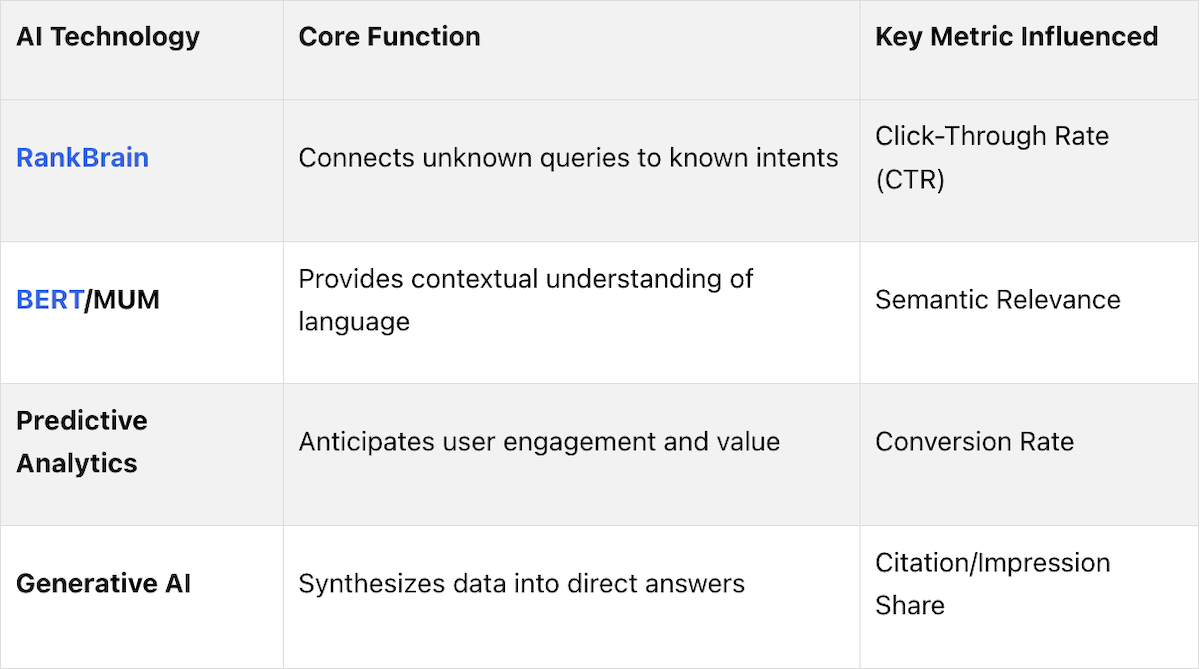
Finally, keep in mind that user behavior is constantly evolving. With traditional search volume expected to drop by 25% by 2026 as people turn to AI chatbots and virtual assistants [3], staying flexible is essential. Regular monitoring, A/B testing, and adapting to new patterns will help ensure your strategy delivers results not just today, but for the long haul.

Conclusion

Search optimization isn’t what it used to be. Modern algorithms now give serious weight to user interaction signals - how people engage with your content is just as critical as technical SEO [4]. This means understanding behavior data has shifted from being a "nice-to-have" to an absolute necessity for crafting effective strategies.

That 25% shift in focus highlights why adapting is so urgent [3]. Search journeys are no longer as simple as typing a query and clicking a link. They now weave through AI Overviews, voice assistants, social media, and even image-based searches. To stay ahead, you need to think beyond ranking for "ten blue links." The goal is to become the direct answer in AI summaries, featured snippets, and other emerging formats [16].

"The future of search is analysing and predicting user behaviour in order to optimise accordingly." - Giulia Panozzo, Neuroscientist and Marketer [3]

This perspective underscores the need for practical strategies. The tools to adapt are already at your fingertips. Metrics like scroll depth, pogo-sticking, and interaction rates can pinpoint where users lose interest or encounter friction. These signals aren’t just numbers - they’re diagnostic tools that help you uncover issues and implement fixes that actually make an impact. Even a small ranking improvement can boost your click-through rate (CTR) by nearly 3% [2].

Taking these immediate steps lays the groundwork for ongoing growth. Long-term success, though, demands constant fine-tuning. Start by setting baseline metrics, breaking down data by device and traffic source, and documenting every change you implement. Pair this hard data with qualitative insights from surveys or session recordings to understand not just what users are doing, but why they’re doing it. As this guide has shown, adapting to user behavior is the cornerstone of search success. With search evolving toward conversational AI and predictive personalization, the winners will be those who treat user behavior data as their secret weapon.

At Lite Studio, we use these insights to craft search strategies that boost engagement and deliver lasting results.

FAQs

How does analyzing user behavior help improve my website's search rankings?

Understanding how users interact with your site - through click-through rates, dwell time, bounce rates, and navigation patterns - plays a big role in your website's search performance. These metrics help search engines gauge how well your content meets user expectations and intent.

By diving into this data, you can pinpoint opportunities for improvement. Maybe your content needs to be more relevant, your pages need to load faster, or the overall user experience could use some polishing. Making these adjustments not only keeps visitors engaged but also sends a strong message to search engines that your site offers real value. Over time, this can help boost your rankings.

What are the top tools for analyzing user behavior data?

To get a clear picture of user behavior, several tools can help you gather meaningful insights:

  • FullStory: This tool captures detailed user interactions, offering session replays and qualitative insights. It’s great for spotting friction points and understanding user pain points.
  • Contentsquare: Known for its visual analytics, this platform includes heatmaps and user journey mapping, making it easier to see how visitors navigate your site.
  • Hotjar: A popular choice for its heatmaps, session recordings, and user feedback surveys, helping you understand what users want and need.

If you’re working with a tighter budget, Microsoft Clarity is a free option that provides session replays, heatmaps, and friction metrics to help you fine-tune your site’s performance. For those interested in AI-powered analytics, Dynatrace offers advanced behavior tracking across multiple channels. Meanwhile, Mixpanel focuses on in-depth product analytics, ideal for tracking user engagement and conversions.

The right tool for you depends on your goals - whether it’s improving user experience, boosting conversions, or diving deep into behavioral data.

How will AI reshape search optimization by 2026?

AI is transforming the way search optimization works, moving the spotlight away from traditional search rankings to AI-driven responses. Instead of focusing only on attracting clicks, businesses will need to fine-tune their strategies for AI systems that generate and prioritize answers directly within their platforms.

By 2026, this shift will make mastering answer engine optimization (AEO) a key factor for maintaining online visibility. Companies that adjust swiftly to this new approach will have a better chance to connect with users and remain competitive in a search environment increasingly dominated by AI technology.

Key Points

What are the essential user behavior metrics every business should track?

  • Click-through rate (CTR): Measures relevance and appeal of search results
  • Bounce rate: Indicates content quality and user satisfaction
  • Session duration: Shows how engaging and valuable content is to visitors
  • Scroll depth: Reveals which content sections capture attention
  • Navigation patterns: Identify user journey friction points and optimization opportunities

These metrics provide actionable insights for improving both user experience and search visibility.

How can businesses optimize for mobile user behavior effectively?

  • Page load speed: Sites must load under 3 seconds to retain 53% more visitors
  • Responsive design: Ensure seamless experience across all device sizes
  • Touch-friendly navigation: Optimize buttons, menus, and interactive elements
  • Content hierarchy: Prioritize key information above the fold for mobile screens
  • Local search optimization: Mobile users frequently search for nearby solutions

With 59% of traffic coming from mobile devices, these optimizations directly boost engagement and conversions.

What role does AI play in analyzing user behavior for search optimization?

  • Pattern recognition: Identifies trends in user interactions and preferences
  • Predictive modeling: Forecasts user intent and behavior changes
  • Real-time personalization: Adapts content and recommendations dynamically
  • Conversion optimization: Uses behavior signals to improve user journeys
  • Search ranking factors: AI systems analyze engagement metrics for SERP positioning

By 2026, traditional search volumes may drop 25% as AI-powered tools reshape how users discover content.

Which tools provide the most actionable user behavior insights?

  • Google Analytics 4: Comprehensive tracking of engagement metrics and user journeys
  • Google Search Console: Monitors CTR, impressions, and search performance data
  • Heatmap tools (Hotjar, Clarity): Visualize user interactions and identify friction points
  • A/B testing platforms: Test variations to optimize engagement and conversions
  • Session recording software: Observe actual user behavior patterns

These tools deliver data-driven insights that enable precise optimization of user experience and search performance.

How do engagement metrics translate into improved business outcomes?

  • Conversion rates: Engaged visitors convert at 4.4x higher rates than disengaged users
  • Revenue growth: Optimized user experiences directly increase sales and lead generation
  • Search visibility: Better engagement metrics improve organic rankings and traffic
  • Customer retention: Satisfied users return more frequently and recommend services
  • Competitive advantage: Superior user experience differentiates your brand in search results

Data-driven optimization transforms user behavior insights into sustainable business growth.

What are the key strategies for implementing user behavior optimization?

  • Continuous monitoring: Track metrics weekly and adjust strategies based on performance
  • Content optimization: Use scroll depth and session data to improve content placement
  • Technical improvements: Optimize load speeds, navigation, and mobile responsiveness
  • Regular testing: Conduct A/B tests on high-traffic pages to maximize engagement
  • Schema markup: Implement structured data to enhance content extractability
  • Cross-device consistency: Ensure seamless experience across all platforms and devices

Lite Studio specializes in implementing these strategies to drive measurable improvements in search performance and user engagement.

Get Started

Streamline your online presence and captivate users with a refined, single or minimal page experience. Schedule a call with our team today to discuss how we can simplify your site and elevate your brand in just 30 days.

Schedule Call